This is the monthly update of the state of Indian stock markets. As of now, it comprises only of Nifty50’s P/E, P/BV ratios and Dividend Yield.


The numbers are averages of P/E, P/BV and Dividend Yield in each month. The maps don’t show the maximum and minimum values of each month.
Caution – Please remember that relying solely on averages can be risky. Its like a 6-feet person drowning in a river which had an average depth of 4-feet. 🙂
So do not make any investment decision based solely on just one or two ‘average’ indicators. At most, treat these heat maps as broad indicators of market sentiments.
So here are the Heat Maps…
P/E (Monthly Average)

P/E Ratio (on last day of May 2016): 22.60
P/E Ratio (on last day of April 2016): 21.24
P/BV (Monthly Average)

P/BV Ratio (on last day of May 2016): 3.40
P/BV Ratio (on last day of April 2016): 3.27
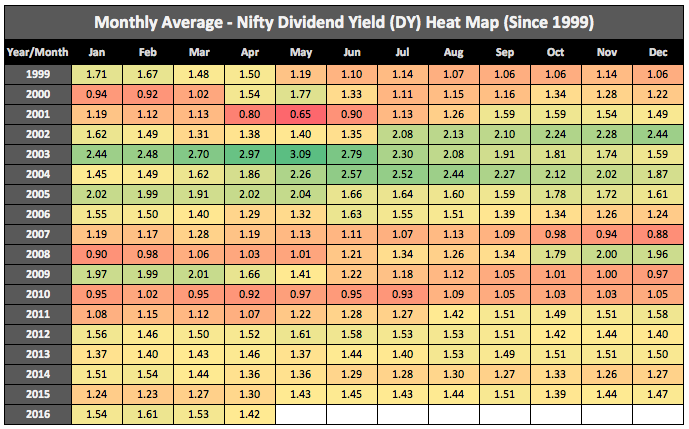
Dividend Yield (Monthly Average)

Dividend Yield (last day of May 2016): 1.32%
Dividend Yield (last day of April 2016): 1.37%
You can read about last month’s update here. The State of Markets section has also been updated (link).
For detailed analysis of the relation between investments made at various P/E, P/BV and Dividend Yield levels and the historical returns, I suggest you have a look at these 3 posts:
- Nifty P/E Ratio Vs Returns Analysis
- Nifty P/BV Ratio Vs Returns Analysis
- Nifty Dividend Yield Vs Returns Analysis